Product Profile:
ChinaAMC CNI Semiconductor Chips ETF

Key Charastics
-
Largest semiconductor thematic ETF in China:
launched in Feb 10th 2020. AUM standing at RMB 16.47bn
-
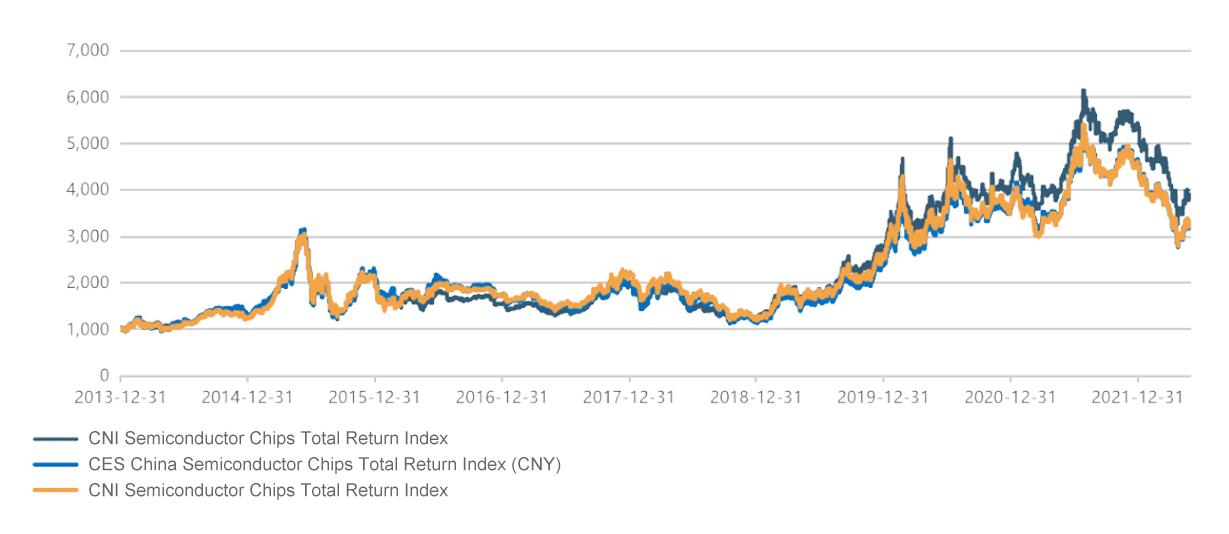
Outstanding performance:
Outperformed the CES CN Semiconductor Index in last 1,3 and 5 years, interval returns of 11.9% (vs. -13.8%), 119.5%
(vs.103.3%), 187.3% (124.2%)
-
Highly institutional:
Institutional investment of RMB 10.63bn, accounting for 60.6% of its total AUM
-
Highly liquid:
Over RMB 660mn daily turnover on average, the highest among all peer funds
-
Comprehensive coverage:
Index covers the entire chip industrial chain, including material, equipment, design, manufacturing, package fabrication
and testing
AUM
(RMB100mn)
|
Average daily
turnover
(RMB100mn)
|
Tracking
error (%) |
Fee rate
(Management fee
/custody fee, %)
|
Number of
market makers
|
Client structure
(Institutional/
retail %)
|
|
|
|
|
|
|
Source: Wind Info, data as of June 13, 2022. ChinaAMC CNI Semiconductor Chips ETF and its feeder fund: The fund is an equity fund with higher risks and returns than hybrid funds, bond funds and money market funds. ChinaAMC CNI Semiconductor Chips ETF: The fund can invest in STAR Market stocks and is therefore subject to specific risks associated with the STAR Market mechanism in respect of factors such as stocks, market rules, and trading rules, including but not limited to higher price volatility, liquidity risk, and delisting risk. ChinaAMC CNI Semiconductor Chips ETF Feeder Fund: The fund mainly invests in ChinaAMC CNI Semiconductor Chips ETF and aims to achieve a similar return to the underlying index. The following factors may cause the deviation of the fund's portfolio from the benchmark or may cause the fund's tracking error control to miss the specified target: 1) deviation of the target ETF from the underlying index; 2) price differences, transaction costs and impact of trading that occur when the fund buys and sells units of the target ETF; 3) tracking error due to the adjustment of the fund’s asset allocation structure; 4) tracking error caused by fund subscriptions and redemptions; 5) tracking error caused by the size of the fund’s cash assets; 6) tracking errors arising from the fund's management fees and custody fees; and 7) deviations caused by other factors. The fund is an ETF feeder fund, but it may deviate from the target ETF’s performance due to differences from the target ETF in terms of investment methods, trading methods, etc.
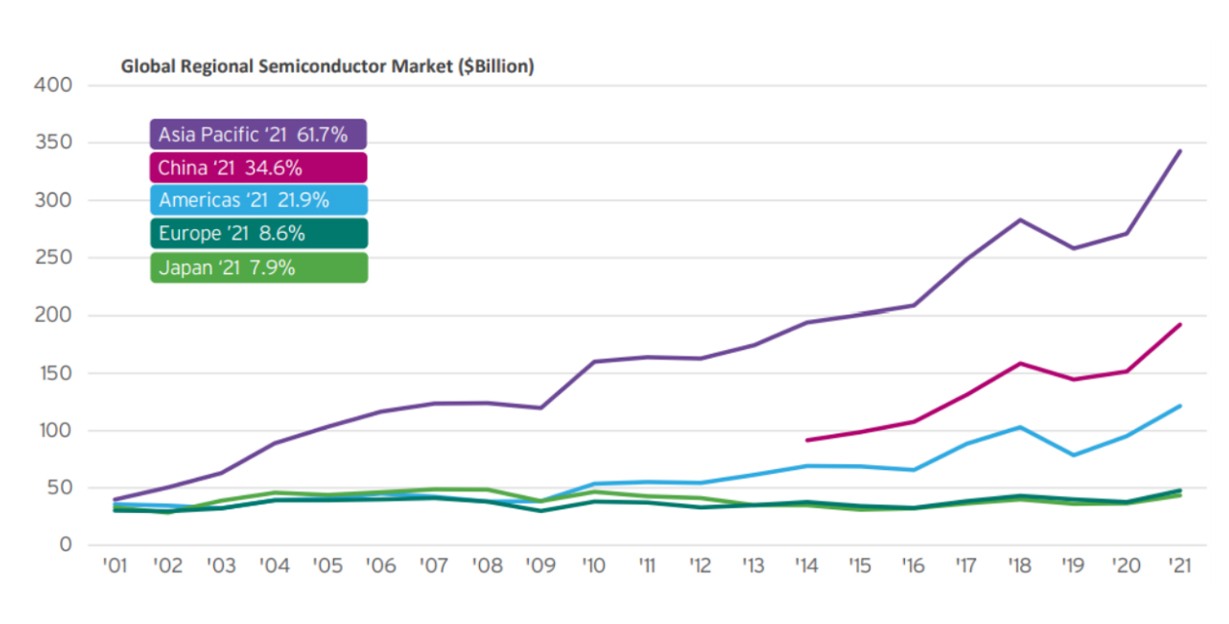
China: The world's largest consumption
market for semiconductor
China is the world’s largest semiconductor consumption market in 2021, with a market size of USD 192.5bn, accounting for 34.6% of the global market and 56.1% of the Asia-Pacific market.
Source: WSTS, SIA
Global semiconductor market size (USD bn)
China is pushing the localization of
semiconductor chips
The output value CAGR from 2021 to 2026 is expected to reach 13.3% and sales CAGR 8.0%, with the self-sufficiency rate expected to reach 21.2% by2026.
Huawei’s sanction by the US government since the end of 2018 prompted device manufacturers to start taking substantial measures for domestic replacement:
2014~2018:
Phase 1 of the state-backed China Integrated Circuit Industry Investment Fund (CICF) was followed by a top-down nationwide IC
development initiatives
From 2019 to the present:
Device manufacturers took their own initiatives to replace imports with local suppliers
Investment logic for semiconductor chips
-

Short Term: Price Cycle
Driven by supply and demand, cycle of 2 years
-

Long Term:
Localization and Import
Substitution
Pain point and core driver of China’s semiconductor chips industry, to last 10 years
-

Mid Term: Innovation Cycle
Instigated by innovation every 3-5 years, i.e. 4G, 5G, smartphones, smart EV
China rolls out multiple measures to promote the IC industry
Given the critical role of the IC sector in driving the country’s economic and social development, China has introduced a series of comprehensive policies to grow the industry since 2000.
China’s IC industry policy timeline
China’s IC industry policy timeline
 close
close
 About ChinaAMC