 close
close
About ChinaAMC
close
 About ChinaAMC
close
About ChinaAMC
Contact Us
close
Contact Us
close
Contact Us
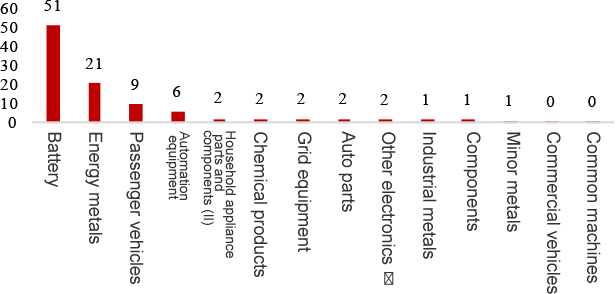
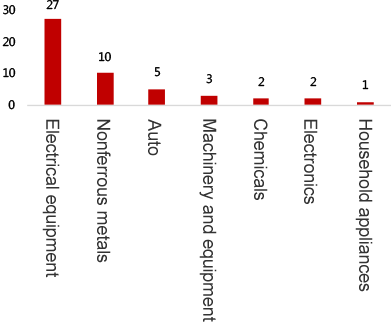
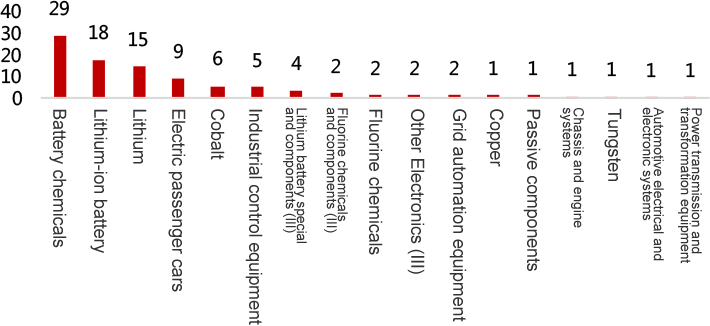
 The NEV industry chain is wide-ranging from upstream to downstream.
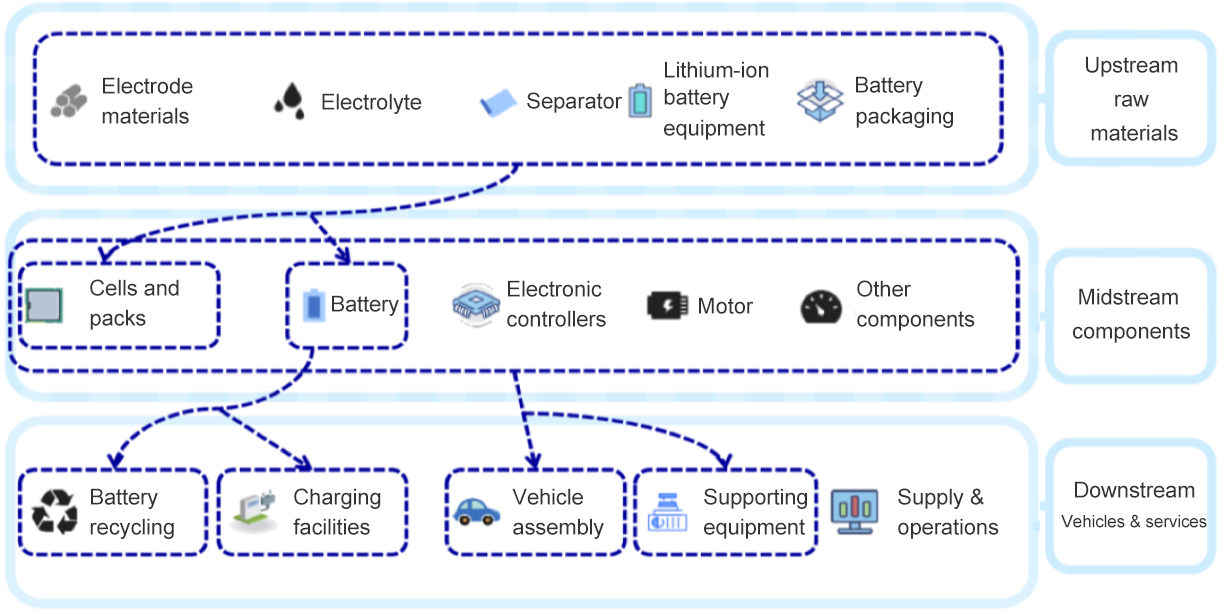


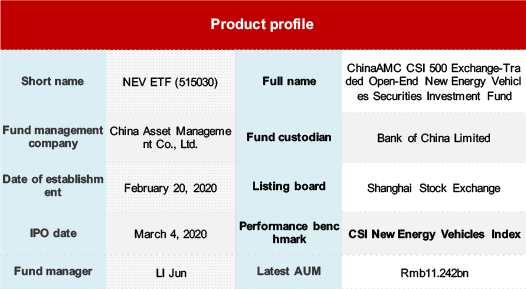
 ChinaAMC CSI New Energy Vehicles ETF
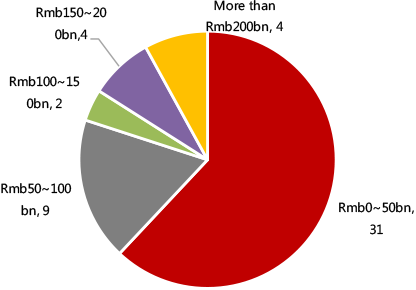
 Leading in AUM